
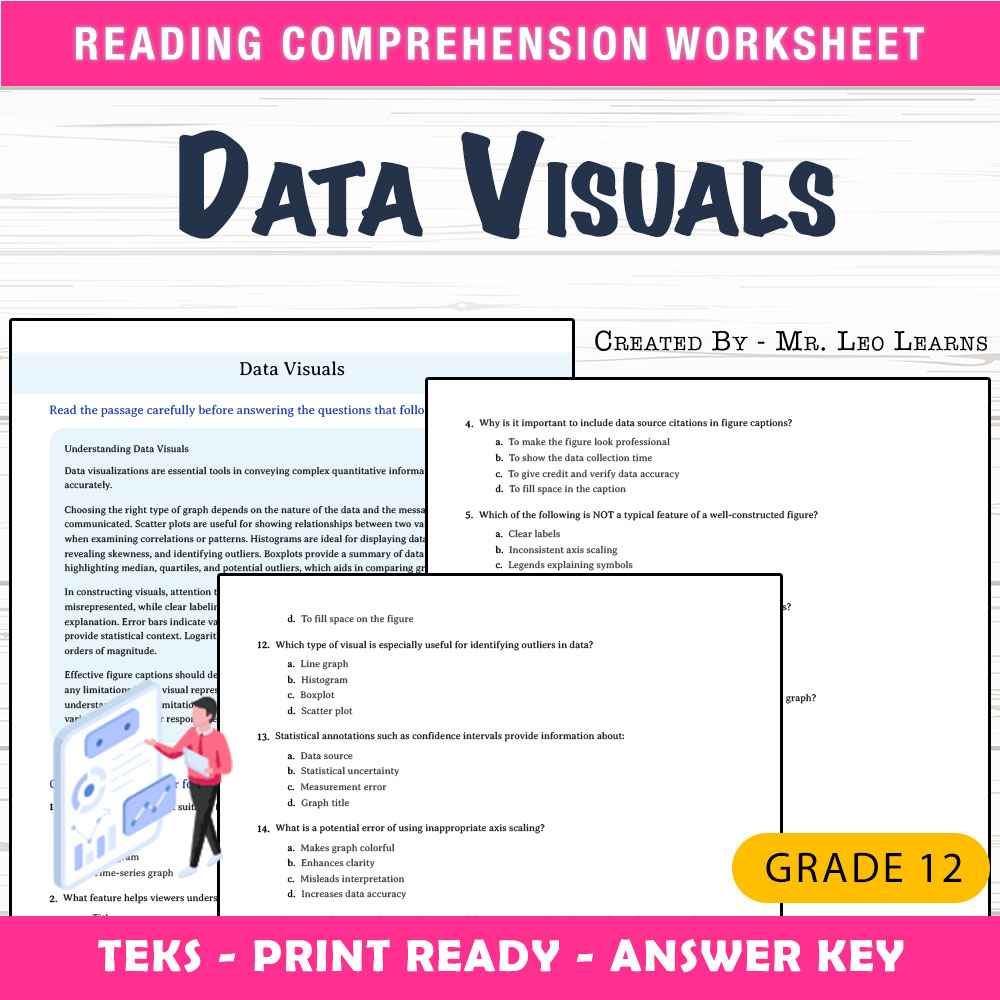
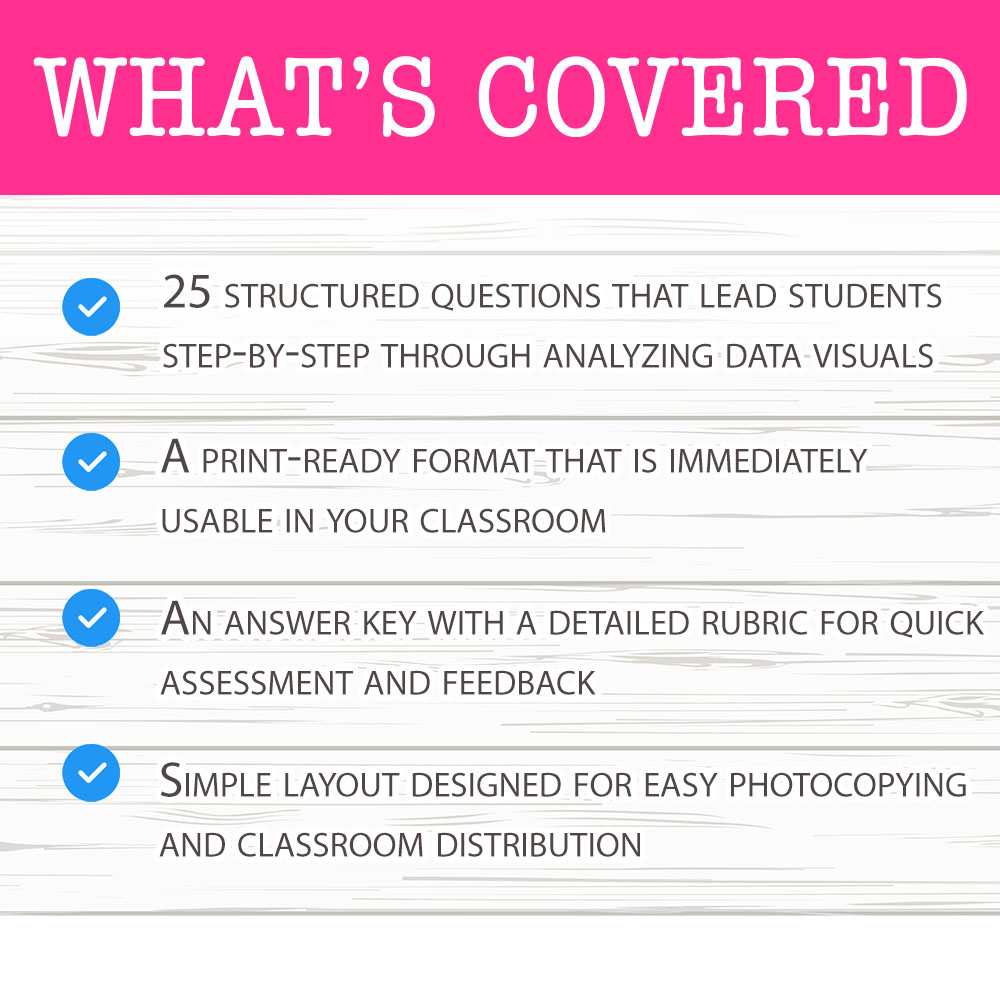
Grade 12 Science – Data Visuals Worksheet for Mastering Graphs & Charts
$3.00
The Resource Hub
·2 followers·11 sales
SubjectScienceGradeGrade 12StandardsTEKS SCI.12.16Answer keyIncluded
Learning Objectives
Understand the principles of selecting appropriate graph types for data representation.
Identify key features of effective data visuals such as axis scaling, error bars, and annotations.
Learn how to construct and interpret scatter plots, histograms, boxplots, and time-series graphs.
Reviews & Feedback
Loading reviews...
Questions & Answers
Loading questions…
About this worksheet
Related categories
Frequently asked questions
Who is Grade 12 Science – Data Visuals Worksheet for Mastering Graphs & Charts designed for?
Grade 12 Science – Data Visuals Worksheet for Mastering Graphs & Charts is designed for Grade 12 students and Science learners and can be used in classrooms, homeschool, or independent practice.
How do I download Grade 12 Science – Data Visuals Worksheet for Mastering Graphs & Charts ?
Add it to your cart and complete checkout. After payment, you can download immediately from your account, and you'll also receive a download link by email.
Does Grade 12 Science – Data Visuals Worksheet for Mastering Graphs & Charts include an answer key?
Yes — an answer key is included with this worksheet to help teachers and parents grade work quickly and accurately.
What type of worksheet is this?
Grade 12 Science – Data Visuals Worksheet for Mastering Graphs & Charts is a worksheet worksheet for Science, suitable for Grade 12 level.
Similar Products

Grade 7 Science – Graphic Representation & Data Visualization | Daily Worksheet
$4.00

Grade 10 Science Representing Data Worksheet | Graphs, Charts & Axes | Ontario
$5.00

Grade 6 Science – Graph Selection & Data Visualization | Daily Reading Worksheet
$4.00

Grade 12 Science – Data Visuals Daily Reading Worksheet with Answer Key
$3.00

Grade 11 Science | Uncertainty Graphs & Data Analysis – Daily Reading Practice
$5.00